Fetching 311 requests, traffic incidents, cameras, permits, property records and boundaries from data.calgary.ca, and estimating today's population. The first load of a ward takes about a minute; the whole city about five minutes the first time, then much less.
Live from City and Calgary Police open data
Ward 5 map
311 requests each month
Newest 311 reports
The latest requests logged in Ward 5
Crime and safety
Who represents this area
Elected at each level, with the last result and turnout
Crime in Ward 5
By type of crime
By community
Missing persons: police appeals
Checking the Calgary Police news releases…
Read live from the Calgary Police Service news releases each time and never saved. The police take an appeal down once the person is found, and it disappears here too. The police do not publish counts of missing persons by ward or community. Anyone with information should call the Calgary Police non-emergency line, 403-266-1234, or 911 if the person may be in danger.
Crime in Calgary compared with other cities
Rents and vacancy near Ward 5
Who lives in Ward 5
Population today against the 2021 Census
311 requests by City service
Population month by month since the 2021 Census
Families, schools, growth and amenities
Licensed child care spaces
Spaces per 100 children, by community
Children aged 0 to 14
Students in Ward 5 schools
Largest schools
Development permits
Road construction
City projects in and near Ward 5
Amenities by community
Playgrounds and children per playground, by community
Traffic cameras in Ward 5
Each camera replays its last 30 minutes on a loop
Open requests by type
Most requests still open today
Ward 5 against Calgary
Police-reported social disorder
All communities
Select a column heading to sort. Select a row to show it on the map.
Open issues
Every 311 request still open in Ward 5
"Still open" is how the City's data marks them, not proof the work is undone. Many older requests are still marked open, some for years: some may be finished but never closed, especially "311 Contact Us" messages, which the list below leaves out unless you untick the box. The office can send 311 a list of request numbers to review: filter the list, then use "Save this list".
Request
Opened
Days open
Type
Community
Department
Last update
Request details come from the City's 311 open data, updated daily. The City publishes the community for each request, not its address, and its own status page shows a request only to the person who filed it.
Families and schools
Licensed child care and school enrolment in Ward 5, from Government of Alberta open data
What changed: Growth vs amenities
Revised 5 November 2026: the earlier and the new method side by side, and what changed in the findings
Growth vs amenities
How near homes are to everyday amenities, and how many people share the playgrounds and parks within reach
Compare wards
Every ward side by side, from the same City data
Ward in focus
Add wards (pick any)
Building the whole-city figures from the City's live data. The first time takes about five minutes; after that, under a minute.
Side by side
Every ward ranked
Map of wards
Election Data Centre
Seats, leaders, constituencies and the latest official results: City of Calgary 2025, Alberta 2023 (with by-elections since and the 2026 referendum), Canada 2025
Live map
Calgary News stories where they happened, traffic incidents as they are reported, the newest 311 requests and police-reported crime by community
Calgary News
The day's Calgary stories
Federal Budget 2026
The Government of Canada's budget, tabled 5 November 2026: headline numbers, every measure, province by province, Calgary and Alberta
Invest in Calgary
Every business in Calgary, where each kind is underserved for the people nearby, where new ones are opening, and business plans from the Business Economist
Connect your AI
Use Calgary Insight inside Claude, ChatGPT or any AI app that supports connectors
Find help near me
A bed tonight, food, a warm place by day, health care and help lines in Calgary, nearest to you first
Calgary Capital Markets
Calgary's public companies: how many, in which industries, what they are worth together, and Calgary's place in Canada's stock markets
Infrastructure condition
Where roads and pipes are wearing out, and whether 311 requests about them are rising in the same places
Learn City Services: YYC Game
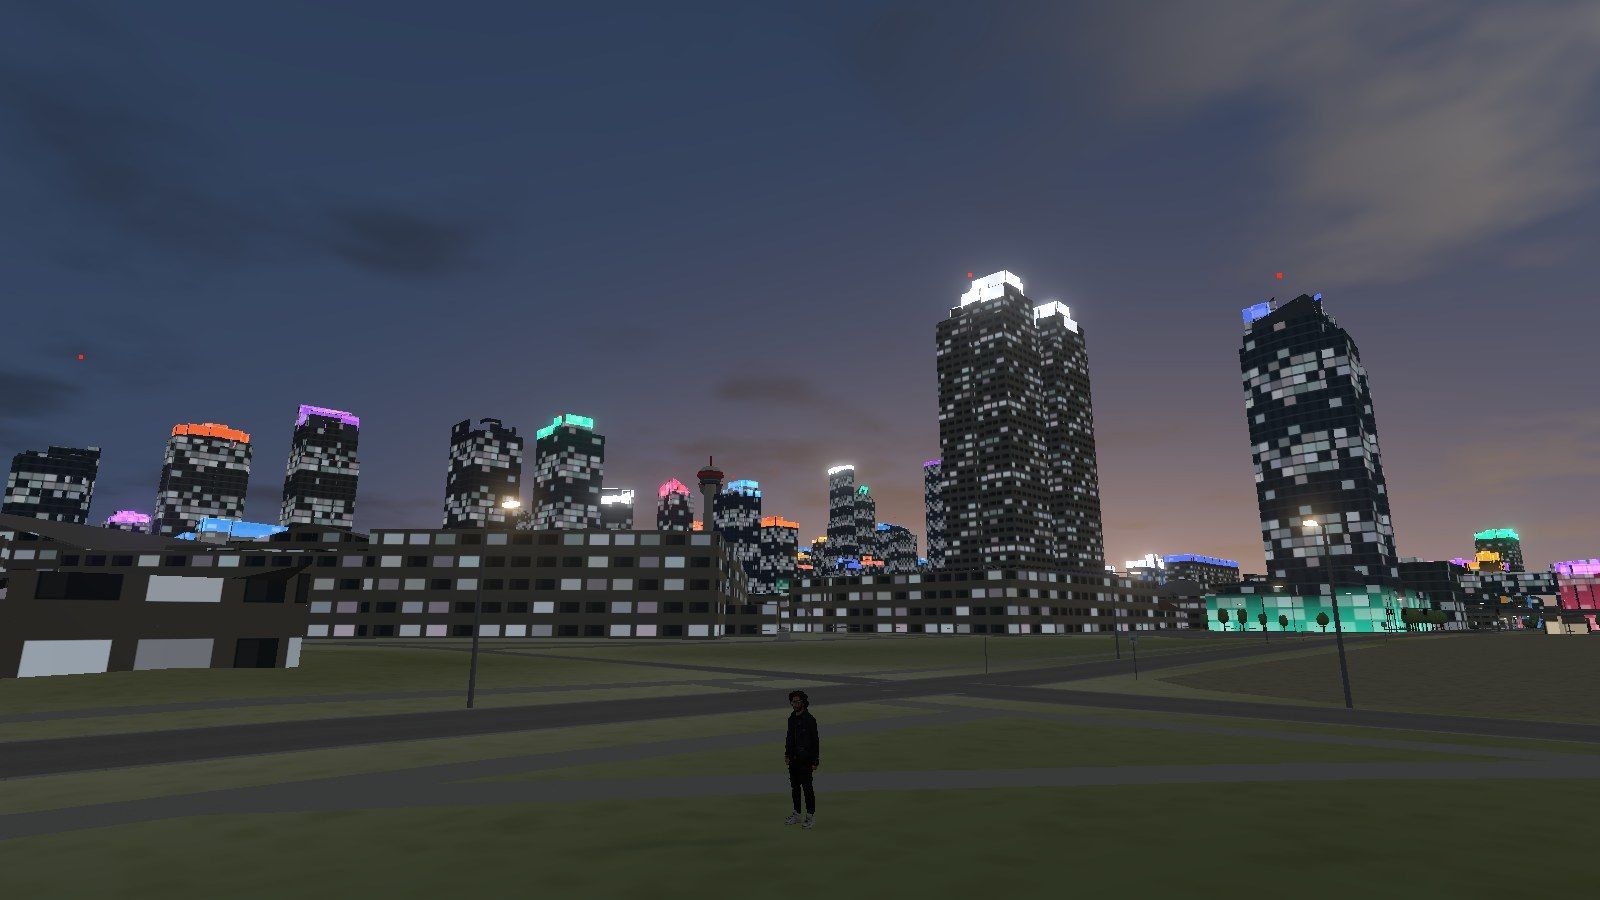
A free learning game on the real map of Calgary, built from the City's open data, that teaches residents how to use City services
Learn how the City works by living in it
Players walk, drive and ride the CTrain through Calgary as a newcomer, a student, a senior or a long-time resident. Each mission is a real task, like getting settled, getting a driver's licence, finding a seniors' program or putting out the right cart, and ends with a short card on the real City service, the official link and a quick quiz.
Streets, buildings, addresses, businesses, parks, traffic signals, transit and ward boundaries all come from City of Calgary open data, so what players learn applies to the city they live in.
What to see, where to stay, the weather by month and over the years, what is on, and how to get around, from public data and the organisers' own pages
Canada's safest cities
Statistics Canada's Crime Severity Index for every city of 10,000 people or more: the 50 safest, and where Calgary stands this year and last
City budget
The City of Calgary's approved budget and spending, live from its open data
Proposed 2027–2030 budget
Operating budget by department
Net of recoveries, millions of dollars
Capital budget by department
Millions of dollars
Year by year
Where the money comes from
Property tax by ward
By ward
Every service
Budget Intelligence & Accountability Centre
The City of Calgary's budget: what is approved, what was spent, what is proposed, and every request behind it
Loading
Video Explainers
Short narrated videos on what the data shows, with how it is measured. Pick a topic or an area, or search.
14 °C on Sunday, a snowfall warning on Tuesday: how often does November bring this much snow?
Published · 36 s · animated, narrated, with music
On Tuesday, November 17, 2026, Environment Canada put the City of Calgary under a snowfall warning. Its update at 10:46 a.m. (Alberta time) said general snowfall totals of 15 to 20 cm are expected, with Calgary on the lower end of that range, and that the snow will taper off Wednesday evening (a forecast, not a measurement). Two days earlier, on Sunday, November 15, the Calgary airport station reached 14.2 °C, and through Monday, November 16, it had measured no snow at all this month (Environment Canada daily data, provisional). In the 100 Novembers from 1926 to 2025, the airport recorded 15 cm or more of snow over two consecutive days in 21 of them, about one November in five; the most recent was 2024 (23.1 cm on November 22 and 23).
Transcript
The hook. Fourteen degrees on Sunday. A snowfall warning today.
The warning. Environment Canada has put Calgary under a snowfall warning: fifteen to twenty centimetres expected, with Calgary at the lower end.
Before. Sunday's high at the airport was fourteen point two. And through Monday, the airport had measured no snow at all this month.
A hundred Novembers. We checked every November since nineteen twenty-six. Fifteen centimetres or more over two days happened in twenty-one of them.
How often. About one November in five. The last time was twenty twenty-four.
On November 14, 2026, the Calgary airport weather station reached 13.9 °C by 4 p.m. (Environment Canada station data, preliminary). The average high on November 14 from 1991 to 2020 was 4.6 °C. Of the 100 November 14ths from 1926 to 2025, only four were warmer: 1979 (18.7 °C, still the record for the date), 1936 (16.7 °C), 1953 (16.1 °C) and 1975 (15.0 °C). 1940 and 1949 also reached 13.9 °C, so November 14, 2026 ties them for fifth place since 1926.
Transcript
The hook. Almost fourteen degrees. In the middle of November.
Today. That's what Calgary's airport hit today. The usual high for this date is under five.
A hundred years. So we checked every November fourteenth for the last hundred years.
Only four. Only four were warmer than today.
The record. Nineteen seventy-nine still holds the record, at eighteen point seven.
Today's place. That puts today in the top five of the last century.
Your turn. Did you get outside and enjoy it? Yes or no?
Growth or Spending? Calgary's proposed 15% property tax increase
Published · 3 min 33 s · animated, narrated, with sound
Is the proposed 15% about growth or about spending? Population growth plus inflation comes to about 16% by 2030, against about 44% for the proposed tax path. Water Services is the biggest single increase in operating spending, and it is paid mainly through water bills. The City's proposed requests for 2027 add up to about $355 million of new money, mostly under its safety and infrastructure themes, and about 78% of it is ongoing. The requests do not say how much would be paid by property tax. The proposed 2027 capital budget, about $4.4 billion, is close to the City's 2026 capital spending forecast (about $4.2 billion) and about 1.8 times its 2025 forecast. Because all homes share one tax rate, a semi-detached house could pay about 18% more in 2027 and a condo about 8% (estimates). Half of growth since 2021 was concentrated in five wards, which have fewer transit stops and recreation sites per person.
Transcript
Opening. Next year, Calgary wants fifteen percent more in property tax. So we asked one simple question. Is that about growth, or about spending?
A city that grew fast. Calgary has grown fast. About one point six million people now, about twenty-one percent more than in twenty twenty-one, on the City's own estimates. If growth is the reason, the numbers should line up.
We added it up. So we added it up. Population growth plus inflation comes to about sixteen percent by twenty thirty. The tax plan adds about forty-four. Almost three times as much.
What is driving spending. So what is driving the spending increase? The biggest single increase is not police, and it is not transit. It is Water Services, at forty-three percent of the increase in operating spending. But here is an important distinction. Water is mainly paid through your water bill, not property tax.
What new spending is requested. So what new spending is the City asking for? Next year, its requests add up to about three hundred fifty-five million dollars. That is a separate figure from the tax increase: the requests do not say how much property tax would pay for. Nearly a third falls under safety: the Safer Together plan, police, and more transit peace officers. Almost as much falls under infrastructure, led by infrastructure maintenance, starting at sixty-two million dollars a year. Transportation comes next, mostly transit: a low-income pass and more service. And nearly eight of every ten dollars is ongoing. If approved, it would carry into later years' budgets.
What pace would the plan require? Then there's the building. The proposed plan includes about twenty-one billion dollars of capital over four years, about four point four billion of it in twenty twenty-seven. That is close to the four point two billion the City forecasts spending in twenty twenty-six, and about one point eight times its forecast for twenty twenty-five. More than forty per cent of the new capital requests are for water, wastewater and stormwater. Large projects are built by contractors, and the City lists a tight labour market as a risk. Capital that isn't spent is moved to later years. So the question is not only what Calgarians would pay, but what pace the plan would require.
The twist. But here is the part nobody talks about. That fifteen percent is not the same for everyone.
Two neighbours. Picture two neighbours. One owns a semi-detached house. The other owns a condo down the street. Condo values have been falling, while houses have barely moved. So the house could pay about eighteen percent more, and the condo about eight. Same city. Same budget. Very different bills.
Where the growth landed. And the growth itself? Half of it was concentrated in just five wards. Those wards have about a third fewer transit stops per person, and seventy-three percent fewer City recreation sites per resident.
Growth or spending?. So, growth or spending? Growth explains part of the increase. But the proposed tax rise is much higher than the growth and inflation benchmark. That does not automatically mean the difference is waste. It means Calgarians deserve to understand what they are paying for.
Council's choice. And Council can still change the number. A ten percent increase instead of fifteen would mean an estimated one hundred twenty-eight million dollars less in revenue than the proposed increase.
Over to you. Council debates the budget from November twenty-third. The full study, with every number, is at calgary insight dot c a. So tell us. Is fifteen percent fair? Drop your answer in the comments.
Figures as of November 13, 2026. Sources: The City of Calgary (2027 budget, 2027 to 2030 budget data, 2027 to 2030 budget request business cases, City financial reports 2023 to 2025, BuildForce Canada, property assessment rolls, Calgary and Region Economic Outlook), CREB (July 2026) and the calgaryinsight.ca growth model. Every figure and source: the full study. Download the video (MP4, 10 MB)
What Calgarians pay: the proposed budget, and Calgary against seven cities
Published · 2 min 45 s · animated, narrated, with sound
A typical Calgary home pays the City $369 a month for property tax, water, wastewater, stormwater and waste, the lowest of eight large Canadian cities. The proposed 2027 budget adds about $53 a month (property tax revenue +15%; about +16% on the typical home's tax), and if the reported increases pass, about $567 a month by 2030 (+54%, a scenario before inflation). In 2027, on the figures published so far, Calgary would be the third lowest.
Transcript
Opening. A typical home in Calgary pays the City three hundred and sixty-nine dollars a month, for property tax, water and waste. The proposed budget would raise that. So how does Calgary compare with other large Canadian cities?
What we compared. We compared eight cities: Calgary, Edmonton, Vancouver, Toronto, Ottawa, Winnipeg, Saskatoon and Regina. For each, we took the City property tax on its typical home, and the City bill for water, wastewater, stormwater and waste, at the same water use.
The proposed 2027 budget. First, the budget. The City proposes a fifteen percent increase in property tax revenue for twenty twenty-seven. For a typical home, the City says property tax rises from two hundred and twenty-nine dollars a month to two hundred and sixty-six, and water and waste from one hundred and forty to one hundred and fifty-six. That is fifty-three dollars more a month, or about six hundred and thirty dollars a year.
Water. Water is a big part of it. The typical water bill rises about twelve percent next year, mostly for wastewater, as the City upgrades two treatment plants and builds new feedermains.
The four years to 2030. If the reported tax increases for the following years pass, water rises as Council approved, and cart fees rise as the City proposed, a typical home would pay about five hundred and sixty-seven dollars a month by twenty thirty. That is fifty-four percent more than today, before inflation.
The comparison, 2026. Now, the comparison. In twenty twenty-six, Calgary's three hundred and sixty-nine dollars is the lowest of the eight cities. Saskatoon and Winnipeg are close behind. Vancouver, Edmonton and Ottawa pay the most, more than five hundred dollars a month. The other seven cities average four hundred and sixty-seven.
Property tax and utilities separately. Calgary is the third lowest on property tax alone, and the third lowest on utilities alone. Together, it comes out lowest.
Against household income. Against what households earn, Calgarians pay the smallest share of the eight: about four and a half percent of the median household's income.
2027, where published. In twenty twenty-seven, using what other cities have published so far, Calgary would be the third lowest. Its gap below the average would narrow from about ninety-eight dollars a month to about fifty-seven. Toronto, Ottawa and Vancouver have not published their twenty twenty-seven figures yet, and Edmonton's and Regina's are still proposals, so this will change.
Why tax rates alone mislead. One caution. Tax rates on their own mislead. Vancouver has the lowest rate, but its homes are worth far more, so its bills are the highest. What matters is the dollars a household pays.
Sources, and your own bill. Every figure comes from each city's own budgets and rate schedules, and every source is published with the study. Read it at calgary insight dot c a. To work out your own bill, enter your home's assessed value at calgary insight dot c a slash bill.
Figures as of November 10, 2026. Sources: The City of Calgary (2027 budget, 2026 and 2027 water rates, cart fees proposed in October 2026), each city's 2026 budget, tax and utility rates, the City of Winnipeg's 2026 Adopted Budget and Statistics Canada (2021 Census). Every figure, source and formula: the full study; work out your own bill at calgaryinsight.ca/bill. Download the video (MP4, 10 MB)
Calgary’s potential as a tourist hub
Published · 3 min 50 s · animated, narrated, with music
Calgary welcomed 10.5 million visitors in 2025, who spent $3.3 billion; hotels were 67.5% full and tourism and hospitality supported 84,000 jobs. About two dollars in three came from Canadians (Alberta $1.0 billion, the rest of Canada $1.2 billion) and one in three from abroad (United States $538 million, overseas $521 million), and international visitor spending rose 15.6% in the first quarter of 2026. YYC handled 19.4 million passengers with 110 non-stop destinations, and more than 7 million international travellers connect through it each year without leaving the airport: every 1% who stayed would be 70,000 more visitors. Banff National Park had a record 4.5 million visitors in 2025–26, and five UNESCO World Heritage Sites are within a few hours’ drive. The goal is $6 billion in visitor spending by 2035, about 6% growth a year.
Transcript
Opening. Calgary. A city of big skies, with the Rocky Mountains on its doorstep. How far could tourism here really go? Here is what the numbers say.
Today. In twenty twenty-five, Calgary welcomed ten and a half million visitors. They spent three point three billion dollars. Hotels were sixty-seven and a half percent full. And tourism and hospitality supported eighty-four thousand jobs.
Who spends. So where does that money come from? One billion dollars comes from Albertans, and one point two billion from the rest of Canada. Visitors from the United States and overseas add just over one billion more. Put together, about two dollars in every three come from Canadians, and one in three from abroad. And that international share is growing. In the first quarter of twenty twenty-six, international visitor spending rose more than fifteen percent.
The airport. The hub is already built. Calgary's airport handled nineteen point four million passengers in twenty twenty-five. It flies non-stop to one hundred and ten destinations. Fifteen new routes were added in a single year. And twenty twenty-six brought its first non-stop flights to South America and the Middle East: Sao Paulo, and Abu Dhabi.
The opportunity. Here is the opportunity. More than seven million international travellers connect through Calgary every year, and never leave the airport. What if a few of them stayed? Every one percent who stay would mean seventy thousand more visitors. It has already started. Since June twenty twenty-six, a stopover program lets travellers on two WestJet routes from the United Kingdom add up to seven days in Calgary, at no extra airfare.
The gateway. Calgary is also a base camp. Banff National Park just set a record: four and a half million visitors in a single year. And Calgary is its nearest international airport, about one hundred and thirty kilometres away. Five UNESCO World Heritage Sites sit within a few hours' drive, along with the Badlands, dinosaur country, and Blackfoot heritage.
Events. And the city already knows how to draw a crowd. The Calgary Stampede generated seven hundred and twenty-one million dollars across Alberta in twenty twenty-five, a third more than in twenty nineteen. Meetings and conventions brought seventy-five thousand delegates, and two hundred and forty million dollars. Sport, culture and major events added nearly one hundred and twenty-three million more.
Lessons from elsewhere. Other places have turned passing traffic into tourism. Iceland offered a free stopover of up to seven days. Its visitor numbers roughly tripled in six years. Singapore gives transit passengers a free city tour. More than eighty thousand took it in twenty nineteen. Denver, another gateway to the Rockies, measured two hundred and nineteen dollars in visitor spending for every dollar of advertising. And Dubai, with festivals all year round, fills almost eighty-one percent of its hotel rooms. Calgary fills sixty-seven and a half. Not everything will carry over to Calgary. But the ideas have been tested.
The target. Tourism Calgary has set a target: double visitor spending, to six billion dollars, by twenty thirty-five. That means growing about six percent, every year, for ten years. Growth has costs too: crowding in Banff, and pressure on housing from short-term rentals. They need weighing alongside the gains.
Close. The visitors are already coming. The hub is already built. The room to grow is international. These figures are the published estimates of Calgary's own tourism bodies, checked in November twenty twenty-six. See the full study at calgary insight dot c a.
Published · 1 min 47 s · animated, narrated, with music
In 1969, one enclosed bridge crossed 4 Avenue SW, linking the Calgary Inn (today’s Westin) to Calgary Place, about 15 feet above the street. Today the City counts 86 Plus 15 bridges and more than 16 km of walkways. The City’s records show 11 bridges built in the 1970s and 31 in the 1980s. On the busiest bridges, 19,000 to 22,000 people crossed every winter workday in City counts from 2011 and 2012, and January counts were about double July’s. The City’s own study found uneven hours, the name signed 11 different ways, and some routes with stairs but no ramp.
Transcript
The mystery. Imagine walking through downtown Calgary in the middle of winter. Snow is falling. The streets are cold. But what if you could cross most of downtown without stepping outside? Welcome to the city above the city.
The original vision. In the nineteen sixties, Harold Hanen, an architect in the City's planning department, imagined downtown buildings joined by enclosed bridges, about fifteen feet above the street. In nineteen sixty-nine, the first one was built, linking the Calgary Inn, today's Westin, to Calgary Place.
An entire network. One bridge became many. The City's records show eleven more in the nineteen seventies, and thirty-one in the boom of the nineteen eighties. Today, the City counts eighty-six bridges and more than sixteen kilometres of walkways, linking offices, hotels, shops and transit.
The weather effect. And the weather shapes how people use it. In City counts from twenty eleven and twenty twelve, the busiest bridges carried nineteen to twenty-two thousand people every winter workday. The City's network study found January counts were about double July's.
The challenges. But a city above the city has its challenges. Most walkways run through private buildings, and owners keep different hours. Standard hours end at nine on weeknights and seven on weekends. A City study found the network's name signed eleven different ways, and some routes with stairs but no ramp.
The bigger question. More than fifty years after the first bridge, the Plus Fifteen is still one of Calgary's boldest experiments. And it raises a bigger question for winter cities: should people move through the city above its streets, or on them? Explore Calgary's stories at calgary insight dot c a.
The pipes beneath Calgary: how old are our sewer connections?
Published · 3 min 34 s · animated, narrated, with music
The City’s open data doesn’t include its sewer mains, so this looks at the connections: the City-owned section of each home’s sewer line, from the main to the property line (367,671 with an install year; 2,782 km). The typical connection went in in 1995; 24.8% are older than 50. Against published service lives for each material, 32,720 (8.9%) are past their typical life: 25.8% on the short benchmark, 2.3% on the long one. If none were replaced, that would reach 43,464 by 2046 and 77,608 by 2071. Four in five of those past typical life have no specific material recorded (“Other” 17,877, code “TP” 7,582, blank 957) and are given 45 years. Age is a warning sign, not proof that a pipe has failed.
Transcript
Opening. Right now, beneath Calgary's streets, nearly thirty-three thousand of the pipes that carry sewage away from homes and buildings have passed the life that pipes like them are expected to last.
The wave ahead. And if none were replaced, that number would more than double by twenty seventy-one. So, how old are the pipes under your feet?
What is counted. The City's open data doesn't include its sewer mains, so this study looks at the connections. The City publishes the public section of each home's connection, from the main to the property line. Nearly three hundred sixty-eight thousand of them, about two thousand eight hundred kilometres of pipe.
The method. Each record has the year the pipe went in, and what it's made of. We set each pipe's age against published service lives for its material: a short, a typical, and a long benchmark.
How old. The typical connection went in in nineteen ninety-five, so it's thirty-one years old. But one in four is more than fifty.
Materials. Two in three are plastic, expected to last about a century. One in five is clay tile, mostly from the sixties and seventies. Cast iron, expected to last about sixty years, is three percent. And half of it is already past that.
The verdict. Against the typical life for each material, about nine percent of connections are past it. Judged by the short end of the range, it's one in four. By the long end, about two percent.
One honest caveat. One honest caveat. Four in five of the pipes past their typical life have no specific material on record, so the study gives them a cautious forty-five years. Age is a warning sign, not proof that a pipe has failed.
Where. The oldest networks are in Calgary's established communities. Among those with at least a thousand connections, Inglewood, Renfrew and Banff Trail are oldest, with the typical pipe from the mid nineteen-fifties. In Wildwood, three in four connections are past their typical life.
The newest. In the newest communities, like Alpine Park and Glacier Ridge, the typical pipe is just two or three years old.
The wave. The bigger story is the wave behind them. The boom years of the seventies laid more connections than any decade before. As those pipes age, the count past typical life climbs. About forty-three thousand by twenty forty-six, and seventy-eight thousand by twenty seventy-one.
The fix: relining. The City is already fixing pipes from the inside, sliding a new liner through the old one, with little or no digging. Its records list about four thousand relined connections. Seven hundred ninety-one are dated twenty twenty-five, more than three times as many as in twenty seventeen.
311 requests. And residents report sewer problems. In twenty twenty-five, Calgarians made about fourteen thousand three-one-one requests about sewer back-ups, sewer maintenance and catch basins.
The bigger picture. Calgary isn't alone. Across Canada in twenty twenty, nearly fourteen percent of smaller sewer pipes were rated poor or very poor. And a City report lists nine large wastewater river crossings, of unknown condition, among the assets whose failure would have severe consequences.
What the data can’t show. What the open data can't show is the condition of each pipe. The City reports condition only as totals, in its asset management plan, not pipe by pipe. With pipe-by-pipe inspections, age could become a true picture of risk.
Close. Every figure and source is listed with this video. Explore your city, community by community, at calgary insight dot c a.
Figures as of November 8, 2026, recomputed independently from the raw data. Method: each connection’s age (2026 minus install year) against low, typical and high benchmark lives for its material; communities use connections placed inside City community boundaries, shown for communities with 1,000+ connections. Sources: City of Calgary open data, Public Sanitary Service Lines (xesp-3jc3) (excludes large commercial and multi-family lines), 311 Service Requests (iahh-g8bj) (13,937 sewer back-up, sewer maintenance and catch basin requests in 2025, duplicates removed) and community boundaries (surr-xmvs); benchmark lives: District of Saanich, Useful Life Summary (2023: PVC and clay 100, cast iron 60, unknown 45, liners 45) and Halcrow Pacific for IPART, Review of Sydney Water’s asset lives (2007: clay 50–150, Sydney Water 130); Statistics Canada, storm water and wastewater infrastructure, 2020 (8.7% poor and 5.1% very poor, sewer pipes 450 mm or less); City of Calgary, IP2026-0102 Attachment 1 (9 wastewater river crossings, unknown condition, severe consequence of failure, $400M capital over 10 years); City of Calgary, 2026 Corporate Asset Management Plan, Appendix B (condition reported for the wastewater asset class as a whole). Relining years are as recorded; a few relined pipes carry their original install year. Original music. Download the video (MP4, 10 MB)
The Elbow: Calgary’s First Peoples
Published · 2 min 44 s · animated, narrated, with sound and music
Before Calgary had a name, this place already had many: Mohkinstsis (Blackfoot), Wîchîspa Oyade (Stoney Nakoda), Guts’ists’i (Tsuut’ina) and Otos-kwunee (Métis), all meaning “the elbow”. About 8,000 years of people where the Bow and Elbow meet, the stone circles on Nose Hill, Treaty 7 in 1877, the hard years after the buffalo disappeared and the residential schools, and what the Nations are doing today: Elbow River Camp since 1912, the Buffalo Treaty and 130+ bison back in Banff, Kainai’s fire guardians, Áísínai’pi as a UNESCO World Heritage Site, and Taza.
Transcript
Opening. Before Calgary had a name, this place already had many. In Blackfoot, Stoney, Tsuut’ina, and Métis, they all mean the same thing: the elbow.
Calgary’s First Peoples. This is the story of Calgary's First Peoples.
Eight thousand years. For at least eight thousand years, people have lived where the Bow and Elbow rivers meet.
The Nations. The Blackfoot Confederacy: Siksika, Kainai, and Piikani, with the Blackfeet across the border in Montana. The Tsuut’ina, who speak a Dene language. The Stoney Nakoda, people of the mountains. And the Métis, who wintered along the Bow.
The buffalo. Life followed the buffalo. Families moved with the seasons, used every part of the animal, and set careful fires to renew the grass that drew the herds.
Nose Hill. Their homes left marks you can still see. On Nose Hill, stone circles that once held down lodge covers still rest in the grass.
Treaty 7. In eighteen seventy-seven, the five Nations made Treaty Seven with the Crown. The Elders say it was a treaty of peace, and of sharing the land.
Hard years. Then came hard years. By eighteen seventy-nine, the buffalo were nearly gone. For more than a century, children were sent to residential schools, ten of them in and around Calgary.
They held on. But the Nations held on to their languages, their ceremonies, and their stories.
Elbow River Camp. Since the first Stampede in nineteen twelve, Treaty Seven families have raised painted tipis by the Elbow River. Some designs are hundreds of years old.
The buffalo come home. In twenty fourteen, Nations from both sides of the border signed the Buffalo Treaty, to bring the buffalo home. In twenty seventeen, sixteen bison returned to Banff. By twenty twenty-four, the herd had grown past one hundred and thirty.
Fire guardians. The Kainai Nation is building Canada's first fire guardians program, bringing good fire back to heal the prairie.
Áísínai’pi. In twenty nineteen, Writing-on-Stone, a sacred Blackfoot place of rock art, became a UNESCO World Heritage Site.
Today. Today, more than forty-eight thousand Indigenous people live in the Calgary region. Next door, the Tsuut’ina Nation and its partner Canderel are building Taza, with shops, hotels, and entertainment along Tsuut’ina Trail.
Close. Long before it was Calgary, it was the elbow. Their story is Calgary's story. calgaryinsight.ca.
Facts checked November 8, 2026. Sources: City of Calgary land acknowledgement and Indigenous relations; Treaty 7 Elders and Tribal Council, The True Spirit and Original Intent of Treaty 7 (1996); Alberta’s Historic Places and the University of Calgary (Nose Hill and Edworthy Park archaeology); Heritage Calgary (residential schools in and around Calgary); Calgary Stampede (Elbow River Camp); Parks Canada (Banff bison, 130+ in 2024; Áísínai’pi); UNESCO; The Narwhal (Kainai fire guardians); Statistics Canada, 2021 Census (48,625 Indigenous people in the Calgary CMA); Taza Development Corp. Original music. Download the video (MP4, 6 MB)
Where Two Rivers Meet: The Story of Calgary
Published · 2 min 36 s · animated, narrated, with sound and music
Calgary has burned, flooded, struck oil and hosted the world. From Mohkinstsis at the meeting of the Bow and Elbow rivers to a city of more than 1.5 million: the North-West Mounted Police fort (1875), the name Fort Calgary (1876), Treaty 7 (1877), the railway (1883), the 1886 fire and the Sandstone City, the first Stampede (1912), oil at Turner Valley (1914), the Leduc boom (1947), the Calgary Tower (1968), the 1988 Winter Olympics and the 2013 flood.
Transcript
Opening. Calgary has burned, flooded, struck oil, and hosted the world. It all began where two rivers meet.
Mohkinstsis. For thousands of years, the place where the Bow and Elbow rivers join was a gathering place. The Blackfoot call it Mohkinstsis, the elbow.
The Nations. It is the land of the Blackfoot Confederacy, the Tsuut’ina, and the Stoney Nakoda, and home to the Métis.
1875. Eighteen seventy-five. The North-West Mounted Police arrive, and build a log fort where the rivers meet.
The name. Its commander names it Fort Brisebois, after himself. Nobody likes it. In eighteen seventy-six, it becomes Fort Calgary, named by James Macleod after Calgary, on Scotland's Isle of Mull.
1877. Eighteen seventy-seven. Treaty Seven is signed at Blackfoot Crossing, between the Crown and five First Nations.
1883. Eighteen eighty-three. The Canadian Pacific Railway arrives. Calgary becomes a town the next year, and a city in eighteen ninety-four.
1886. Eighteen eighty-six. Fire sweeps through the wooden downtown. Calgary rebuilds in stone, and becomes the Sandstone City.
1912. Nineteen twelve. Guy Weadick stages the first Stampede, backed by four cattlemen known as the Big Four.
1914. Nineteen fourteen. Dingman Number One strikes at Turner Valley, southwest of the city. Calgary goes oil crazy.
1947. Nineteen forty-seven. After the big Leduc discovery, oil companies make Calgary their head office, and the city booms.
1968. Nineteen sixty-eight. The Husky Tower rises one hundred and ninety-one metres over downtown. Today, we call it the Calgary Tower.
1988. Nineteen eighty-eight. Calgary hosts the first Winter Olympics ever held in Canada, and the tower's torch burns for sixteen days.
2013. Twenty thirteen. The Bow and Elbow rise. About seventy-five thousand people are told to leave home, the largest evacuation in the city's history. Calgarians clean up, together.
Today. Today, more than one and a half million people call Calgary home. A city of newcomers, still growing, where two rivers meet.
Close. Calgary's story, explained for everyone. calgaryinsight.ca.
Facts checked November 8, 2026. Sources: The Canadian Encyclopedia (Fort Calgary, Calgary); City of Calgary (naming of Calgary, the 1886 fire, population outlook); Parks Canada (Treaty 7 signing site, Turner Valley oilfield); Alberta Energy Heritage (Dingman No. 1); Canada’s Historic Places (Leduc No. 1); Britannica (1988 Winter Olympics); 2013 Alberta floods. Original music. Download the video (MP4, 6 MB)
Calgary Insight: what it is and what it offers
Published · 1 min 25 s · animated, narrated, with sound and music
A quick tour of Calgary Insight: the daily dashboard for all 14 wards, ward-by-ward comparisons, the 2026 City budget and property tax, neighbourhood amenities and infrastructure, elections, business, safety, news and visiting. Every figure shows its formula and its source. Data Genie and Data Scientist are passcode protected (request access at hello@calgaryinsight.ca), and reports can go through a three-way audit: Chinook re-runs every figure, Bow rules on each finding and writes the corrected report, and Rundle confirms every finding was dealt with.
Transcript
Opening. Calgary's public data is spread across many places. Calgary Insight brings it together in one.
What it is. A free, non-partisan website, made by a Calgarian, at calgaryinsight.ca.
Dashboard. It pulls City data every day: three-one-one requests, traffic incidents, permits and more, for the whole city or any of its fourteen wards.
Compare wards. Put any ward next to the other thirteen.
Budget. See the twenty twenty-six City budget, where the money comes from, and property tax by ward.
Neighbourhoods. See how close homes are to everyday amenities, and what condition the water mains and roads are in.
More. Election data, a business map, Canada's safest cities, daily Calgary news, and a guide for visitors.
Methods. Every figure shows its formula and its source, so anyone can check the work.
AI tools. Two AI tools go further. Data Genie answers any question about the data. Data Scientist writes full analysis reports.
Passcode. Both are behind a passcode. To get one, send a request to the developer, at hello@calgaryinsight.ca.
Three-way audit. Any report can go through a three-way audit. Chinook, the auditor, re-runs every figure. Bow, the reviewer, rules on each finding and writes the corrected report. Rundle, the final checker, confirms every finding was dealt with.
Close. Calgary's open data, explained for everyone. calgaryinsight.ca.
The budget chart shows 2026 operating revenue by source from the City of Calgary’s 2026 Budget as approved; the water main and road gauges are illustrations, not measured values. The 3D ward map uses the City of Calgary’s ward boundaries (open data). Download the video (MP4, 6 MB)
Budget 2026: what's in it for Alberta and Calgary
Published · 2 min 47 s · animated, narrated, with sound
The federal budget tabled on November 5, 2026, searched word by word: Alberta is named 34 times, Calgary twice and Edmonton five times (Québec 74, Ontario 67, British Columbia 41). Alberta's three nation-building projects (Pacific Link, Pathways, Alberta High-Speed Rail), up to $2.5B in waterbomber financing, defence work at CFB Cold Lake and CFB Suffield, Calgary's quantum defence hub and the Silver Springs Community Centre, the grocery benefit supplement, and $9.2B in health and social transfers to Alberta.
Transcript
Opening. On November fifth, Ottawa tabled Budget twenty twenty-six, titled Masters of our destiny. What is in it for Alberta, and for Calgary? Here is a quick look.
The big picture. First, the big picture. The deficit this year is sixty-two point three billion dollars, and about two hundred and eighty-nine billion over five years. The biggest new measure is the Productivity Mega Deduction: businesses can write off new machinery and equipment right away. It is worth about thirty-six billion dollars over five years.
How often each place is named. We searched the whole budget, about two hundred and twenty thousand words. Alberta is named thirty-four times. Calgary, just twice. Edmonton, five times. For comparison, Québec is named seventy-four times, Ontario sixty-seven, and British Columbia forty-one.
Pacific Link. Three of the twenty-eight nation-building projects sent to the federal Major Projects Office are in Alberta. The biggest is Pacific Link: a twelve hundred and fifty kilometre oil pipeline from Bruderheim to the coast near Delta, British Columbia. It would carry one million barrels a day, with at least ten percent offered to Indigenous owners.
Pathways. Next to it is Pathways, large-scale carbon capture in the oil sands. With the Oil Sands Alliance's other commitments, it aims to cut sixteen million tonnes of emissions a year.
Alberta High-Speed Rail. The third is Alberta High-Speed Rail. The budget lists it by name, with no dollar figure yet.
Waterbombers and defence. Alberta-based De Havilland gets up to two point five billion dollars in financing to build more waterbombers in Wheatland County, to fight wildfires in Canada and Europe. On defence, the budget names fighter facilities at CFB Cold Lake, a laboratory at CFB Suffield, and repairs across Alberta's bases.
Calgary. Now, Calgary's two mentions. In August, Ottawa launched the Quantum Defence Innovation Secure Hub in Calgary, bringing quantum, defence and technology organisations together. And the Silver Springs Community Centre expansion is one of the projects named for the new Build Communities Strong Fund.
Households and transfers. For households, there is a one-time Groceries and Essentials Benefit supplement in early twenty twenty-seven, for more than twelve million people on low and modest incomes. And Alberta's federal health and social transfers rise to about nine point two billion dollars this year, roughly eighteen hundred dollars per person.
Close. Every passage that names Alberta is on the Federal Budget page. Calgary Insight.
Figures as of November 6, 2026. Counts are whole-word matches across the budget's chapters, annexes, overview, budget in brief and tax measures. Source: Budget 2026, Government of Canada (budget.canada.ca), tabled November 5, 2026; every passage that names Alberta is on the Federal Budget 2026 page. Download the video (MP4, 9 MB)
Calgary's 26 electoral divisions: a field guide for the 2027 Alberta election
Published · 2 min 19 s · narrated, figures on screen
Alberta votes on October 18, 2027. 13 of Calgary's 26 electoral divisions were won by under 5 points, and in every one the electors who stayed home outnumber the winning margin. The October 2026 referendum, where voters get their news, youth turnout, and a playbook any campaign can use.
Opening. Alberta votes on October eighteenth, twenty twenty-seven. Calgary elects twenty-six of the Legislature's eighty-seven members, and many of the province's closest seats are here. This is what the numbers say, for any candidate.
How close every seat is. Thirteen of Calgary's twenty-six electoral divisions were won by less than five points. In Calgary-Acadia, the margin was twenty-two votes. In Calgary-Glenmore, forty-eight. In Calgary-North West, one hundred and forty-three.
The voters who stayed home. In every division, the people who stayed home outnumber the winning margin. About three hundred and fifty thousand electors on Calgary's lists did not vote. In the Calgary-Shaw by-election this September, turnout was just thirty-six percent, and the seat changed hands by five hundred and ninety-one votes.
The October referendum. The October referendum is the newest map of local opinion. On each of the first nine questions, Calgary's Yes vote was seven to eight points below Alberta's. Eighty-two percent of Calgary voters chose for Alberta to remain a province, against seventy-five percent province-wide.
Social media. Where do voters get their news? Social media now leads television. For half of Canadians aged eighteen to thirty-four, it is the main source of news. YouTube and Facebook lead, then Instagram, TikTok and X. Only thirty-seven percent trust most news, so short, local video with a source goes furthest.
Youth engagement. Young people vote less: sixty-six percent of eighteen to twenty-four year olds, against seventy-six percent of all Canadians. Registration, campus outreach, young volunteers, and plain information on how to vote close that gap, and they help every voter.
The playbook. The playbook for any campaign: know the arithmetic. Map the lowest-turnout polling stations. Register and remind. Listen before you speak. Put local facts on every screen. And measure progress every week.
The full report. The full report has a preview for every one of Calgary's twenty-six divisions. The boundaries are still under review, and every figure will be redrawn on the final map.
Figures as of November 6, 2026. The same rules and arithmetic for every division, candidate and party; nothing here predicts a winner. Sources: Elections Alberta (2023 general election, 2026 by-election and referendum results); City of Calgary Open Data; Statistics Canada, Reasons for not voting (2021); Digital News Report 2026, Canada (Centre d'études sur les médias). Boundaries for 2027 are under review.
Calgary: a hub of innovation, leadership and future growth
Published · 2 min 6 s · narrated, figures on screen
What a new investor should know: a metro that grew 2.9% in a year, Canada's lowest corporate income tax (23% combined), the country's fastest-growing startup ecosystem, the airport, rail and office space already in place, the suburbs short of everyday businesses, and the risks to plan for.
Opening. Calgary: a hub of innovation, leadership and future growth. Here is what a new investor should know, with the numbers, and where they come from.
A growing market. Calgary is home to about one point six million people. In the year to July twenty twenty-five, its metro area grew two point nine percent, among the fastest in Canada. Toronto, Vancouver and Montreal grew half a percent or less.
Ease of doing business. Alberta has Canada's lowest corporate income tax: eight percent provincial, twenty-three percent combined. There is no provincial sales tax, no payroll tax, and no health premium. Invest Alberta puts the advantage at sixteen point nine billion dollars this year.
Innovation. Calgary is Canada's fastest-growing startup ecosystem. It ranks in the world's top fifty emerging ecosystems, worth seven billion dollars, with three point four billion in venture capital since twenty twenty-one, and a tech workforce up sixty-one percent in three years.
Infrastructure. The infrastructure is already here. Calgary's airport carried a record nineteen point four million passengers in twenty twenty-five. Calgary is home to CPKC, the railway linking Canada, the United States and Mexico. And downtown has quality office space on competitive terms.
Where the openings are. Where are the openings? Calgary has about six everyday local businesses for every thousand residents. In fast-growing suburbs like Cornerstone, Cityscape and Belmont, there are fewer than two. Grocery, health, child care and food are the clearest gaps.
Quality of life and risks. Calgary is safer than the Canadian average, and far more affordable than Toronto or Vancouver. The risks to plan for: energy price cycles, high office vacancy, and a cooling housing market.
The full report. The full report lists every source, the steps to set up a business, and the help available. Calgary Data Desk.
Figures as of November 6, 2026. General information, not financial advice. Sources: Statistics Canada; Invest Alberta; Calgary Economic Development; Startup Genome; Calgary Airport Authority; Cresa; CREB; City of Calgary Open Data; OpenStreetMap.
Near, but crowded: parks and playgrounds against population in Ward 5
Published · 2 min 9 s · narrated, figures on screen
Almost every home in Ward 5 is within 400 m of a public park (98.6%; Calgary 98.9%), and 78.7% are within 400 m of a playground (Calgary 71.2%). But the park space within reach works out to 2.9 hectares per 1,000 residents against Calgary's 5.9, the second lowest of the 14 wards, and 2.1 playgrounds per 1,000 children under 15 against 4.1, the lowest. Homes are fuller: 3.6 people per household against 2.6 (2021 Census).
Transcript
Opening. Ward 5 has public parks and playgrounds close to almost every home. But how many people share them? This is amenities against population, measured the same way for every ward in Calgary.
Distance. First, distance. Ninety-nine percent of homes in Ward 5 are within four hundred metres of a public park, about the same as Calgary as a whole. And seventy-nine percent are within four hundred metres of a playground, more than Calgary's seventy-one percent.
Park crowding. Now, crowding. Take the park space within reach of each home, and share it among everyone who can reach it. Ward 5 has about two point nine hectares of park for every thousand residents. Calgary has five point nine. That is about half, and the second lowest of the fourteen wards.
Playgrounds. Playgrounds tell the same story. Within four hundred metres, Ward 5 has about two playgrounds for every thousand children under fifteen, against four across Calgary. That is the lowest of any ward.
Why. Why? Homes in Ward 5 are fuller. The 2021 Census counted three point six people per household, against two point six in Calgary, and three in ten residents were under twenty. The same parks are shared by more people, and more children.
Community by community. Community by community, against Calgary's level of one. Redstone, Saddle Ridge, Skyview Ranch and Taradale have well under half of Calgary's park space per person. For playgrounds, Cityscape, Falconridge and Skyview Ranch are the most crowded.
How it is measured. How it is measured: every park's area is shared among the residents within four hundred metres of its edge, and every playground among the children nearby. Each home then adds up its shares. A score of one means the same as Calgary. Every ward and community is measured the same way on the Growth versus amenities screen.
Close. calgaryinsight.ca. Near is not the same as enough.
Figures as of November 5, 2026, residents counted the dashboard's default way (the City's total shared by actual growth); the Growth vs amenities screen shows today's figures for every ward and community, under every way of counting. Sources: City of Calgary Open Data (parks, playgrounds, property assessments, 2021 Census by community). How it is worked out: How it's counted, "How crowding is worked out" and "How the scores are worked out". Download the video (MP4, 6 MB)
How Calgary's population is shared across its communities
Published · 2 min 21 s · narrated, figures on screen
The dashboard starts from the City of Calgary's own population estimate (1,598,075 in November 2026) and places it community by community: each community's 2021 Census count, plus the people in homes built there since 2021 (from the City's property roll), plus an equal share of the rest of the City's growth, 10.0% of its 2021 count.
Transcript
Opening. How is Calgary's population shared across its communities? It starts with one number: the City of Calgary's own estimate, about one point six million people this November.
The City’s figure. Step one. The City's figure comes from its Spring 2026 Economic Outlook, with an estimate for each April. Between those, we draw a straight line, month by month. Right now, that line adds about seventy people a day.
The starting point. Step two. Each community starts from its own count in the 2021 Census: about one point two nine million people in all. Since then, the City's figure has added about three hundred and nine thousand.
Placing the growth. Step three. Where do those people go? About one hundred and eighty thousand live in homes built since 2021, so they are placed in the community where those homes were built. The other one hundred and twenty nine thousand come from more people in each home, seniors' homes, residences, shelters, and people the Census missed. That part is shared by every community: ten percent on top of its 2021 count.
How new homes are counted. New homes come from the City's property roll. We keep residential accounts with a home on them, and leave out vacant lots, commercial property, parking stalls and storage lockers. A new home counts as lived in one year after it is built, and a rental building counts by its units.
The same rule for every community. Step four. Every community follows the same rule: its 2021 count, times one point one, plus the people in its new homes. Abbeydale, with no new homes, grows to six thousand five hundred and twenty. Cornerstone, with about thirty two hundred new homes, reaches eighteen thousand one hundred and eighty five. Together, every community adds up to the City's figure.
Where the new homes are. This is where the new homes are. The most people in new homes are on the edges of the city: Cornerstone, Livingston, Mahogany, Carrington and Seton.
Close. Calgary Data Desk, by Hassan Ali. When the 2026 Census counts arrive in February 2027, every community gets a new starting point.
Figures as of November 5, 2026; the dashboard shows today's figures, which update with every data refresh. Sources: City of Calgary, Calgary and Region Economic Outlook 2026-2031 (Spring 2026), Table 4; City of Calgary Open Data (2021 Census by community, property assessments, building permits). How it is worked out: How it's counted, "How residents are counted (Settings)". Download the video (MP4, 7 MB)
How every figure is worked out
Every formula, filter and threshold Calgary Insight uses, with its datasets, how to check it yourself, and what to keep in mind
Data sources
Every dataset Calgary Insight uses, what it shows, and what you can ask for: download, analyze or chart
When each part is refreshed
Calgary time. Each source is read again on this schedule; a source that publishes less often (yearly, quarterly) is simply read again and kept until it changes.
When
What is refreshed
Every morning, about 4:20 a.m.a backup start at 5:10 a.m. if the first does not begin
All City of Calgary open data on every screen (311, permits, development, traffic, child care, schools, amenities, property tax), Calgary Police crime data, council and committee votes, House of Commons votes and bills, the City's performance measures, Invest in Calgary businesses, infrastructure condition, Calgary Capital Markets totals, weather. A full build takes one to two hours, and Visiting Calgary's weather (the current year's daily records and the forecast).
With every update to the website
The same full refresh as the morning one.
Every evening, about 5:30 p.m.
Calgary News: the day's edition, with pictures added within the hour.
Every week
Growth vs amenities (distance from every home, crowding, scores), election results, the City's Suburban Residential Growth forecast, major projects in every ward (Government of Alberta Major Projects), park land and facilities already planned, private amenities and the sights and places to stay on Visiting Calgary (OpenStreetMap).
Every Monday, checked by hand
Promises and commitments on Civic Accountability and whether each is kept, City facilities being built that the provincial list misses (fire stations, libraries, recreation), each ward's hand-checked projects, the Calgary Capital Markets company list, and Visiting Calgary's facts, events, fares and visitor figures. Each change is checked against its source before it is published.
Every month
Homes on the City's property roll (the growth model and the population build-up).
Live, while you look
Bus positions (every 30 seconds), the live population counter, traffic cameras, and each source under "Live connections" below when tested.
Live connections
Each source asked directly now, with no saved copies: one small request each. Test one, or all of them together.
Source
Publisher
Status
Time
Source last updated
What came back
Link
Data Genie can also find and use any of the City of Calgary's other open datasets (over 400, alongside data from Calgary Police, the Province of Alberta, Statistics Canada, CMHC, Environment Canada and OpenStreetMap): ask about a topic and it searches the catalogue. Downloads are saved as spreadsheet files (CSV) to the Files tab.
Newsletter
A Ward 5 community update for the months you choose, saved as a PDF
1. Months
Whole months, compared with the same months a year earlier.
2. Wording
3. Sections
Preview
Choose the months and select Create.
The newsletter appears here. You can click any text in it to change the wording, then save it again.
Traffic cameras
City of Calgary traffic cameras, each replaying its last 30 minutes
The City's cameras are for traffic monitoring only. Footage is not recorded, and cameras can be offline for maintenance or after collisions. Source: City of Calgary Open Data, Traffic Cameras (k7p9-kppz).
Data Scientist
Full analysis reports on Calgary and any ward, built from live public data: every figure worked out and sourced, with charts, maps, recommendations and an action plan.
PDF reportInteractive charts and mapsExcel workbook
3 to 8 minper report
Add an AI service key (Anthropic, Google Gemini or OpenAI) in Settings to make reports.
Thorough uses the strongest model: deeper reasoning, longer reports, about twice the cost and time of Quick.
Topics for today
Gather the data
Work out the figures
Draw charts and maps
Write the report
What it is doing
Your reports
Made here or in Data Genie, newest first. Signed in, every report is kept with your account and listed here on any device.
Report auditor
Three separate checks on a finished report. Chinook (the auditor) re-runs every figure from the data and lists what is wrong. Bow (the reviewer) re-checks each finding itself, accepts, revises or rejects it with its reasons, and makes the corrected report. Rundle (the final check) then looks only at those findings: fixed correctly, or rightly rejected. About 5 to 15 minutes a report.
Chinook: re-runs every figure
Bow: reviews each finding and fixes it
Rundle: final check of the findings
What it is doing
Audits
Each audit page lists every finding, the reviewer's decision and the final check, with the corrected report.
Data Genie
Ask anything about Calgary's data: it finds the right datasets among over 400 from seven public sources, runs the numbers, and answers with charts, tables, maps, downloads and full analysis reports (PDF)
What would you like to know?
Ask about the area you have selected (all of Calgary or any ward) or anything the City publishes as open data: for casework, briefings or council meetings. Data Genie answers from the data already in this app first (the dashboard's figures, police crime data, files you have saved), and goes to the City's website only when it needs more.
Add an AI service key (Anthropic, Google Gemini or OpenAI) in Settings to start asking. The dashboard works without it.
Enter to ask. Shift and Enter for a new line. Answers come from the City's open data and show their sources.
Files
Data the assistant has saved
File
Saved
Size
Action
Settings
Saved only on this computer
Ward 5
Newest 311 reports
Most open requests
Data status
Source
Last updated by the publisher
Fetched by Calgary Insight
Status
Calgary Insight checks for new data every 15 minutes and rebuilds the dashboard at least every hour. Select a source to open its page.